One of the biggest strengths of KDE Plasma is its customization, and the System Monitor is no exception.
I have shown this with KDE Konsole tweaks earlier and now I am here to do the same with KDE System Monitor.
Like most other parts of the Plasma desktop, the System Monitor offers plenty of customization options that are easy to overlook.
Let me show you how to transform the default KDE Plasma System Monitor into a clean and powerful system monitoring dashboard.
Understanding the System Monitor Layout
Before we start customizing the System Monitor, let's first understand how KDE Plasma System Monitor arranges sensors on the page.
Take a look at the sample layout diagram below.
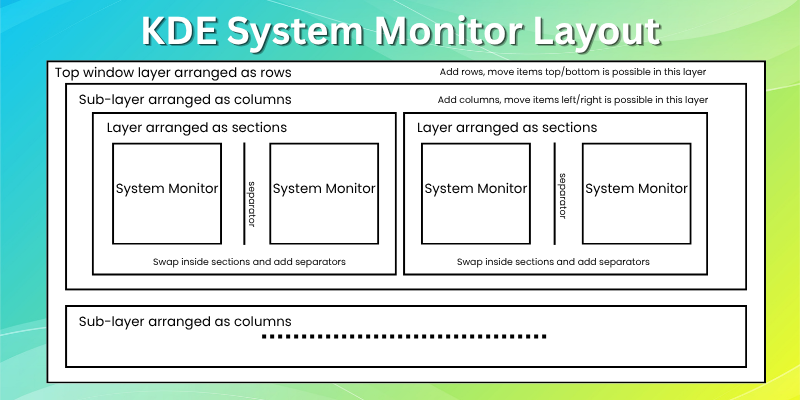
This gives you a general idea of how different elements are organized inside the System Monitor.
At the top is the window layer, where everything is arranged in rows. Inside each row is a column layer, where items are arranged into columns.
Within each column, you'll find sections. These sections hold the individual widgets that display system information.
When you enter the System Monitor's edit mode, which we'll cover in the next section, you can hover over the layout to identify these different layers.
As you add or modify widgets, clicking on a particular layer only shows the options available for that layer.
For example, clicking the column layer lets you add more columns, but not sections.
Likewise, clicking the section layer lets you add additional sections, but not columns.
Keeping this layout in mind will make it much easier to customize the System Monitor without any confusion.
As mentioned earlier, KDE Plasma's default System Monitor includes a few pre-built pages that display essential system information.
If you look closely, you'll notice that each item on these pages is essentially a widget, similar to the widgets you can place on the Plasma desktop.
In other words, the System Monitor app works like a canvas where you can add widgets and configure them however you like.
Add a New Page
By default, the Plasma System Monitor includes four pages:
- Overview: A dashboard that displays multiple system statistics.
- Applications: A list of running applications and their resource usage.
- History: Live graphs for CPU, GPU, memory, and network activity.
- Processes: A list of running processes and their resource usage.
For this guide, we'll create a new page instead of modifying the existing ones.
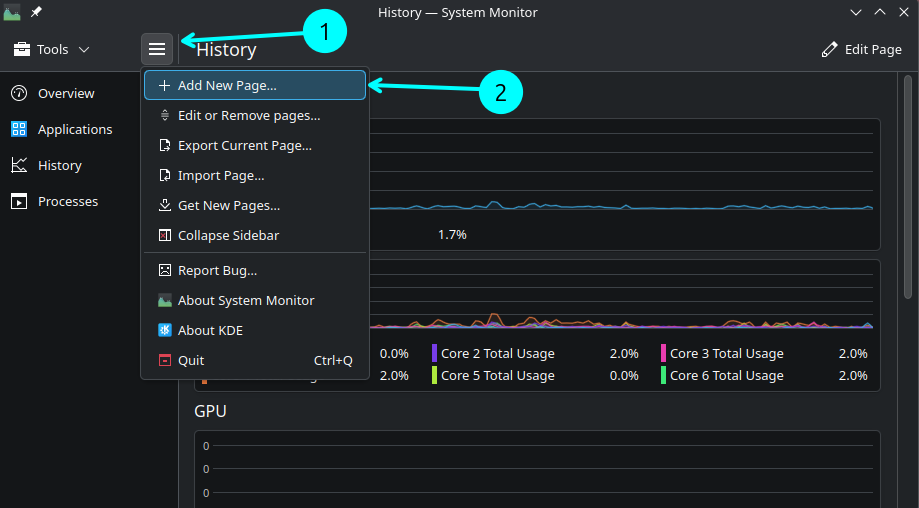
Click the menu button in the top-left corner and select Add New Page.
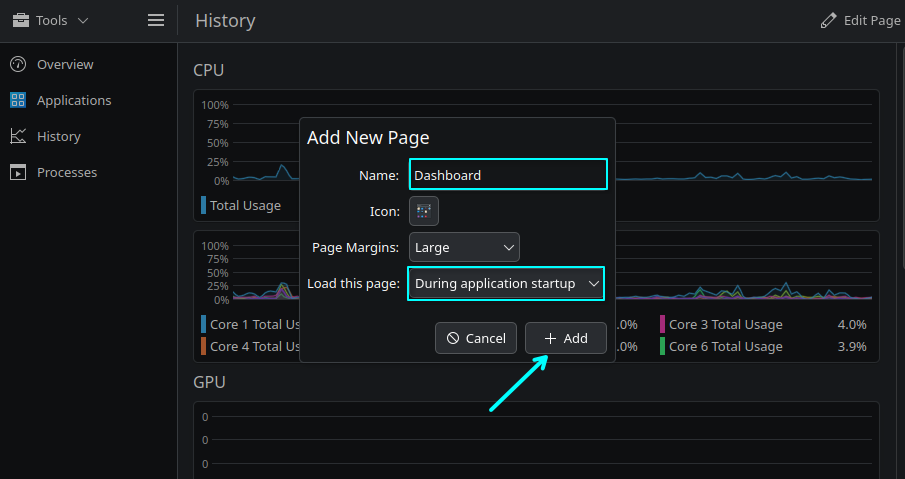
In the dialog that appears, enter a name for the page and choose an icon.
Next, set Load this page to During application startup.
Finally, click Add.
The new page will now appear in the sidebar. Select it to open it.
You'll be greeted with an empty page. This is where we'll build our custom system monitoring dashboard.
Edit the Page
Now that the new page is ready, it's time to customize its contents.
Open the new page and click the Edit Page button in the top-right corner.
Since the page currently contains only one system monitor widget, click on it. This opens a sidebar where you can configure the selected widget.
Let's turn it into a horizontal bar chart that displays the load on each CPU core.
In the sidebar, change the following settings:
- Title: CPU Load Graph (or any name you prefer)
- Display Style: Horizontal Bars
- Sensors: Select the usage percentage for all CPU cores, as shown in the clip below.
Editing the first KDE Plasma System Monitor widget.
Selecting Sensors
Choosing the right sensors is the most important part of building your dashboard. Most System Monitor widgets work similarly to Plasma desktop widgets and let you display different types of system information.
Depending on the widget, you'll usually find two sensor fields:
- Sensors: Displays the selected sensors as charts, graphs, or other visual elements. You can select multiple sensors.
- Text-only Sensors: Displays the selected sensors as plain text instead of charts or graphs.
Clicking either field opens a categorized list of available sensors.
For example, CPU-related sensors, such as usage percentage, per-core statistics, and CPU temperature, are available under the CPU category.
Likewise, RAM-related sensors are grouped under Memory → Physical Memory.
Here are some of the main sensor categories you'll come across:
- CPUs: CPU usage, per-core statistics, temperature, and related metrics.
- Disks: Disk usage, free space, read/write activity, and other storage information.
- GPU: GPU usage, temperature, video memory, and related statistics.
- Memory: RAM and swap usage.
- Network Devices: IP address, download and upload speed, and other network statistics.
- Operating System: Kernel version, hostname, uptime, and other system details.
The exact sensors available will depend on your hardware and system configuration.
Adding a New Row
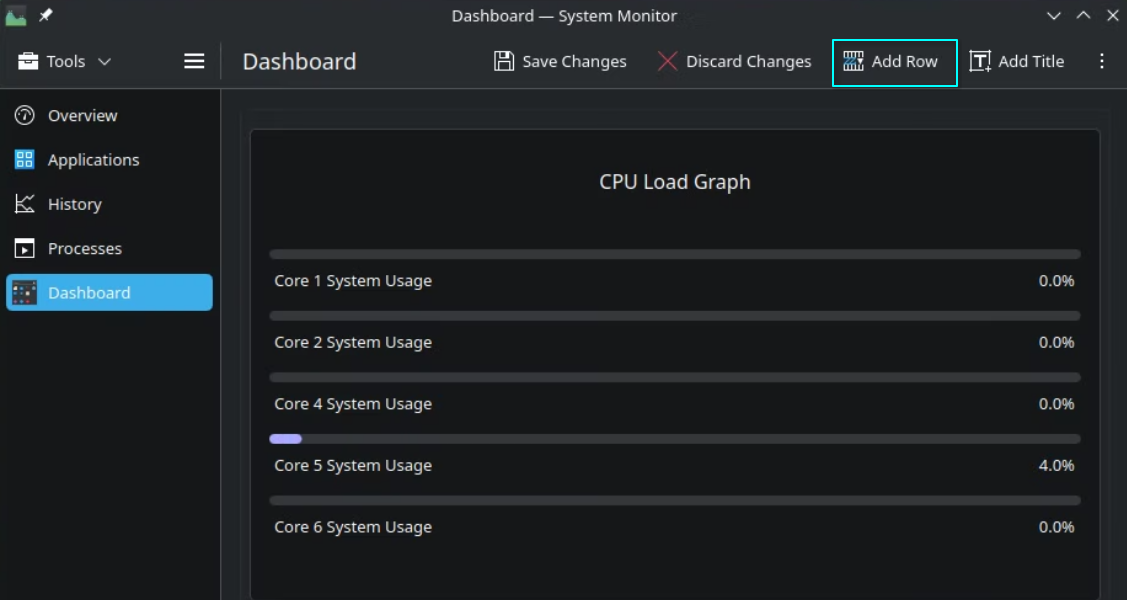
Now that we've added the first widget, let's create a new row to add another one.
While still in edit mode, click Add Row. A new empty system monitor widget will appear below the existing one.
This time, we'll configure it as a pie chart to display used and free physical memory (RAM).
If you'd like to see the complete process, check out the short clip below.
Otherwise, configure the widget with these settings:
- Title: RAM Usage
- Display Style: Pie Chart
- Sensors: Used Physical Memory Percentage and Free Physical Memory Percentage
Adding a RAM usage pie chart to the dashboard.
You can also customize the chart colors if you like, but we'll leave them at their default values for this guide.
Add a Column
If the first section looks a bit too wide, you can split the available space by adding another column.
While in edit mode, click the topmost layer of the widget. This opens the menu for that layer.
From there, select Add → Add Column. The process is shown in the clip below.
Adding a new column using the top layer menu.
A new system monitor widget will appear to the right of the existing one. At the same time, the original widget will automatically resize to make room for the new column.
Using the same editing process as before, I configured this new widget with the Color Grid display style to show additional system information.
Creating a Color Grid widget to display system information.
Change the Position of a Widget
After setting up the dashboard, I felt that the Color Grid would look better before the CPU Load graph.
To move it, I clicked the topmost part of the widget to open that layer's menu.
From there, I clicked on Move and simply dragged the widget to the left of the CPU Load graph.
Moving the column item.
That's all there is to it.
Organize Widgets with Sections
So far, we've added rows and columns and rearranged widgets.
There is one more organizational feature in the System Monitor called Sections.
Sections let you group related widgets together. For example, you can keep all hardware-related sensors in one section and system information in another.
Let's see how it works. I'll demonstrate this on a new page. By now, you should already know how to create one.
In edit mode, click the top part of the section layer, located just above the widget title.
From the layer menu, select Add → Add Section. A new widget will be added to the right of the existing one.
Both widgets now belong to the same section and share a single section header.
To separate them visually, click the section header and select Add → Add Separator.
Add items in sections.
Save Your Changes
Once you're happy with the layout, click the Save Changes button in the top bar.
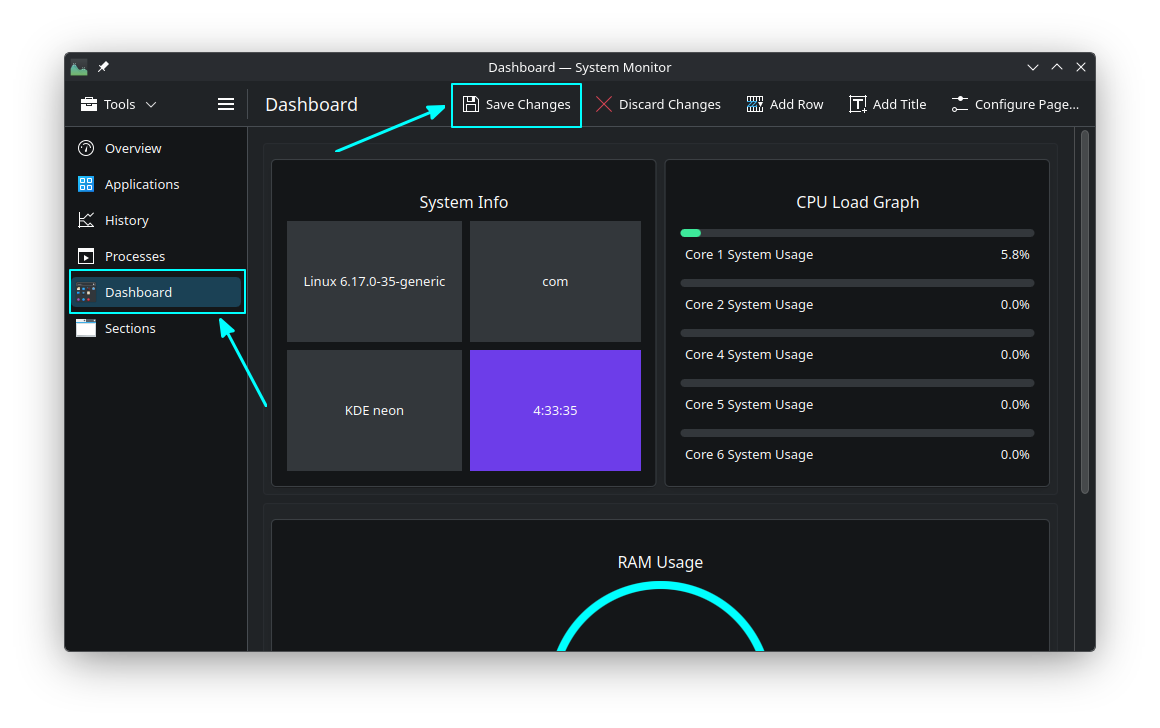
This saves all your modifications and exits edit mode.
Your newly created pages and customized widgets will now be available whenever you open the System Monitor.
Start with Your Custom Page
After creating your custom dashboard, you may want the System Monitor to open with that page by default. Fortunately, that's easy to set up.
Click the menu button in the top-left corner and select Edit or Remove Pages.
In the Start with drop-down menu, select the page you created.
Click OK to save the changes.
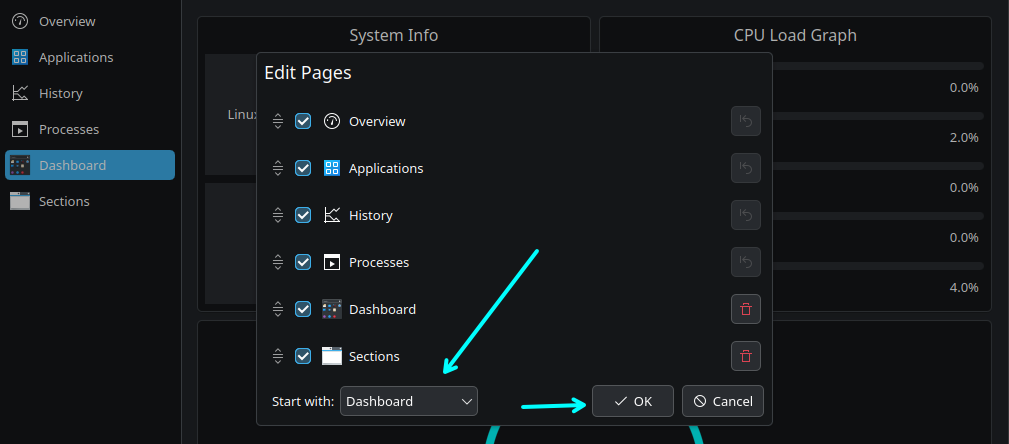
From now on, the System Monitor will open directly to your custom page every time you launch it.
Remove a Page
If you no longer need a page, you can remove it at any time.
Click the menu button in the top-left corner and select Edit or Remove Pages.
A dialog listing all available pages will appear. Click the Delete button next to the page you want to remove.
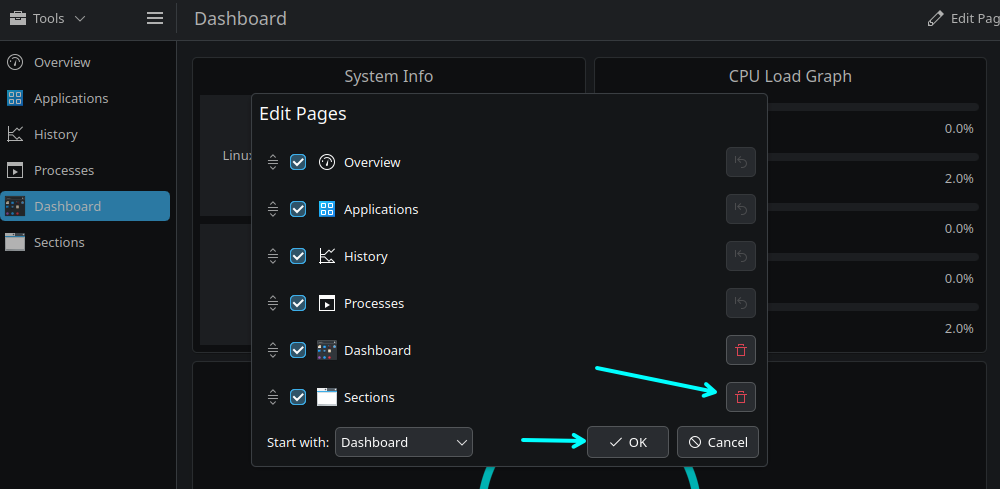
Once you're done, click OK to save the changes.
If you don't want to delete a page completely, simply uncheck it in the list. This hides the page without removing it.
Download Community Pages
You don't have to build every dashboard from scratch. The KDE community has created many custom System Monitor pages that you can download and use.
As with any third-party content, install these pages with caution. They are community-created and may not have been tested by the KDE developers for security or stability.
To browse available pages, click the menu button in the top-left corner and select Get New Pages.
Browse available community created pages
This opens the online catalog, where you can click the Install button next to any page to download and add it to your System Monitor.
Export or Import Pages
If you frequently switch between systems, exporting and importing pages can save you from recreating your custom dashboards every time.
To export a page, first open the page you want to save. Then click Menu → Export Current Page. Choose a file name and click Save.
The page will be saved with the .page extension in your chosen location.
Export a page in KDE System Monitor
To use it on another system, open the System Monitor and select Menu → Import Page. Then choose the exported .page file to add it to your System Monitor.
Wrapping Up
KDE Plasma's System Monitor is much more than a tool for checking CPU and memory usage. It offers a level of customization that many graphical system monitors simply don't provide.
Despite being a GUI application, it gives you plenty of flexibility to build dashboards that suit your workflow.
Have you customized the KDE Plasma System Monitor before, or do you prefer a different system monitoring tool?
Let me know your thoughts in the comments.
from It's FOSS https://ift.tt/BcOhSkd
via IFTTT
Tidak ada komentar:
Posting Komentar